Generate an \(n \times d\) matrix. Each row vector is a probability vector \((p_1, \ldots, p_d)\) with \(\sum_{i=1}^{d} p_i = 1\). The function offers several methods to generate the rows in a way that the components are unbiased which means that they are required to have similar / the same probability distributions.
[1] Maziero, J. Generating Pseudo-Random Discrete Probability Distributions. Brazilian Journal of Physics 45, 377–382 (2015). https://doi.org/10.1007/s13538-015-0337-8
[2] Grimme, C. Picking a Uniformly Random Point from an Arbitrary Simplex. Technical Report. https://doi.org/10.13140/RG.2.1.3807.6968
rrandvec(n, d, method = "normalization", shuffle = FALSE, as.df = FALSE)Arguments
- n
[
integer(1)]
Number of vectors to generate.- d
[
integer(1)]
Number of components of each vector (at least 2).- method
[
character(1)]
One of “norm” (normalization method), “trigonometric”, “simplex” (sample from a unit simplex), “exponential” or “iterative”. Default issimplex.- shuffle
[
logical(1)]
Should the values of each vector be permutatet randomly? Background: methods “iterative” and “trigonometric” introduce unwanted bias (see desciption). This issue can be alliviated by random shuffling. Default isFALSE.- as.df
[
logical(1)]
Should the return value be a data frame with column names X1 to Xd? Default isFALSE.
Value
[matrix(n, d)] \((n \times d)\) matrix even if \(n=1\).
Examples
R = rrandvec(1000, 2)
R = rrandvec(1000, 5, method ="iterative")
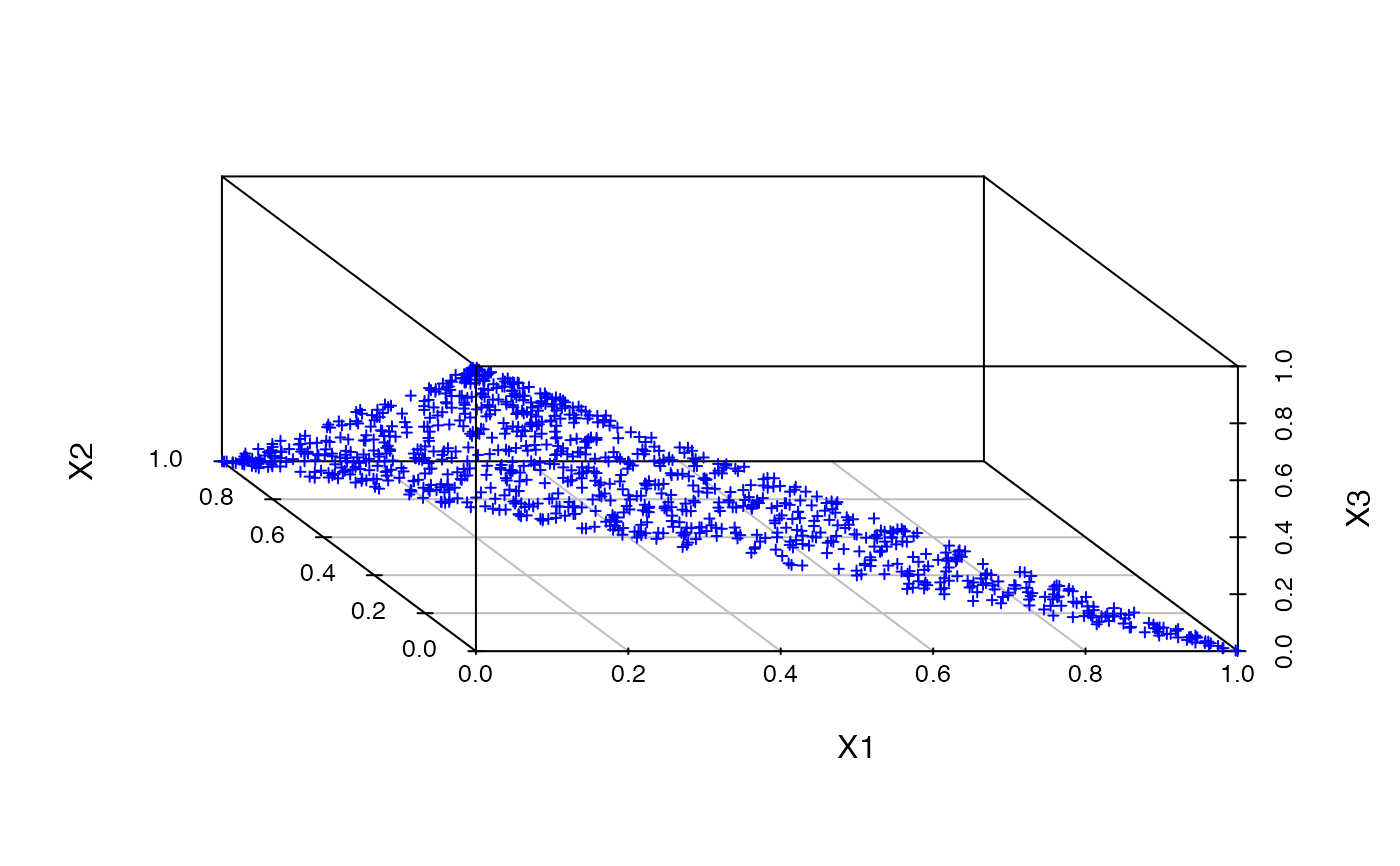
R = rrandvec(1000, 3, method = "trigonometric", shuffle = TRUE, as.df = TRUE)
if (require("scatterplot3d")) {
scatterplot3d::scatterplot3d(R, angle = 120, cex.symbols = 0.5, pch = 3, color = "blue")
}
#> Loading required package: scatterplot3d